When working with records, it is possible to view the flow diagram for the main process that is running on the stream record. It is also possible to view the flow diagram for any subprocess that is running on the record. The options are:
- Show flow diagram - for the main process
- View Flow - for a subprocess
Clicking one of those options pops up a diagram that shows the process flow, and that indicates the current state of processing:
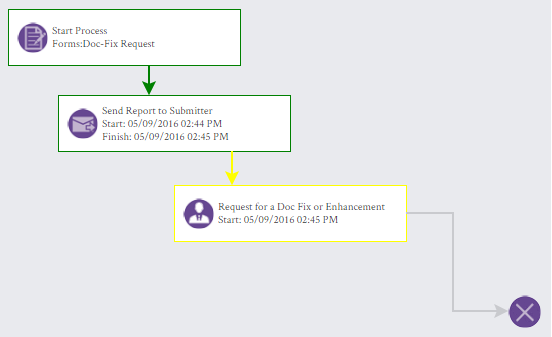
Steps that have been completed have a dark green border.
The next step in the sequence has a light yellow border.
Remaining steps have no border.
(For a slightly deeper look, see Process Streams & How they Flow.)